Can You Make Money Day Trading Forex?

Day Trading ForexCan you make money day trading Forex?

This is a question that has a very simple answer as far as i am concerned. And its a big fat YES.

There are many well respected Forex traders that say the Forex markets are too volatile, and its impossible to make money consistently from day trading Forex, and you should trade the higher time frames, daily, weekly, and monthly charts, if you want to be successful.

What a load of rubbish. If you are a good trader you can trade any time frame from the 1 minute chart right up to up to the monthly.

People that say you cannot make money day trading Forex, don’t know how to trade, its as simple as that.

My preferred time frame is the 15 minute chart, but i can trade the 5 minute and the 1 minute chart very successfully. I can also trade h1, h4, and daily. I can basically trade anything, and anyone that tells you its not possible to trade the smaller time frames is just a poor trader.

Day trading Forex is what i do. I am a professional Forex day trader and i make 1000s of pips every month day trading the 15 minute time frame. Why do i trade the 15 minute time frame? because that is the most profitable time frame to trade.

Trading daily and weekly time frames? You must be crazy.

When you are trading daily and weekly time frames you have to wait so long for a set up, and your stop loss is so big, its just not worth the hassle to be honest. I take 2 to 3 high probability trades every day. I make my money, and i get on with my life. I am not going to wait for 2 weeks for a set up on the larger time frame chart, and have a 100 pip stop. Whats the point? If you are a great Forex trader, you should be able to trade any time frame.

Yes, but trading the smaller time frames is too stressful? Rubbish.

Take The Stress Out Of Day Trading ForexSome traders say trading the smaller time frames is too stressful. Yes it is if you do not know what you are doing, and you get into a trade and it goes 30 pips in the red. Yes i agree, that is very stressful, that is why my entries are very cleverly worked out in advance, and i enter the market with precision, so my trades go into profit very quickly, which takes the stress out of trading. A lot of my trades are over in less than 30 minutes. I get in, i take my pips, and i get out. That’s not stressful, that’s just great trading.

So yes you can make money day trading Forex, and anyone that tells you otherwise, just doesn’t know how to trade. For more information on how you can learn to day trade Forex, please consider my Forex trading course.

Stop Press. One of my students made 87 pips today off 2 trades, after just 5 weeks of training with me. Stop wasting your time with the 95%, and get into the 5%. Supercharge your trading, and change your life. 🙂
How To Trade Pin Bars Or Hammer Candles.

How to trade pin bars or hammer candles as they are also called. Pin bars or hammers can be traded successfully on any time frame, but they tend to be more reliable on higher time frame charts, such as 4 hour and daily charts. Pin bar reversal candles are great price action set ups when traded correctly.

I personally don’t take trades based solely on pin bars or hammer candles, as my trading style is based on other factors, but lots of traders do trade them, and they do make up a large part of price action Forex trading.

I do however take notice of when pin bar set ups present themselves, as it gives me extra confirmation that i am in the correct trade, and it also helps me define a logical exit for my trades.

How to trade pin bars or hammer candles.

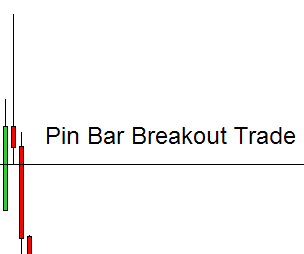
pin bar breakout trade

There are 2 possible entries when trading pin bars or hammer set ups. You can take a breakout entry trade, or you can take a retrace entry trade.

The chart on the right shows how to trade a pin bar breakout entry trade. You enter the trade on the breakout of the low, or the nose as its sometimes called.

The low (nose) is marked by the line, and as soon as the low is broken you will enter the trade short.

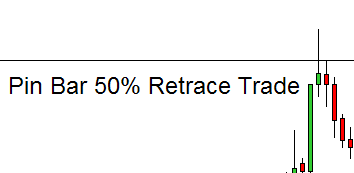
pin bar retrace tradeNow lets look at a how to take a retrace entry trade. A retrace entry trade is when you enter the trade on a retrace of the pin bar.

The most common retrace that Forex traders take is the 50% retrace.

If you measure the height of the pin bar, pin to pin, and divide it by 2 you will get your 50% retrace entry target.

You enter the trade short, when the price moves up 50% of the height of the pin bar, as shown by the chart on the right. The line marks the 50% retrace entry point.

Both of these trades show short set ups, but both can be applied to long set ups too. The candles are just inverted for a long set up.

It is important to know how to trade pin bars or hammer candles, as a lot of traders do trade them, and they do work very well if they present themselves at the correct point on the chart.

This is just basic price action trading. What i trade and teach is high probability price action trading. If you wish to learn this type of trading please consider my Forex training course.

If you found this article to be helpful to you, please like it on Facebook, share it on Twitter, or bookmark it using the social bookmarking buttons below. Thanks. 🙂

How To Make Money From Forex Trading.

how to make money from forex trading

How to make money from Forex trading.

That is a question that many new Forex traders ask. Now if you break the question down into 3 parts, the answer to the question is a lot easier than you think.

First lets look at the last part of the question. Forex trading. What is Forex trading? Answer. Forex Trading is the speculative trading of one currency against another.

Now lets look at the second part. Make money. To make money you have to invest money. If you invest 5 pounds and you get back 6 pounds, you have made money.

Now lets look at the first part of the question. How to. Now this is by far the most important part of the question, and it will give you the answer you are looking for. If you are asking “how to” do something, what exactly are you asking for? You are asking for knowledge. How to cross the road, how to bake a cake, how to drive a car. All of these skills require you to have the knowledge needed to complete the task.

So lets put all the parts of the question together. I am asking for knowledge, on how to get a return on my investment, in the speculative trading of one currency against another.

Now we know what we are actually asking, and what we are actually seeking, we can now ask the question again. How to make money from Forex trading. The answer to the question is knowledge. Knowledge of how the Forex market works, knowledge of currency pairs, knowledge of risk, knowledge of probability, knowledge of price action.

You have heard the saying knowledge is power right? Well knowledge when it comes to Forex trading is the ultimate power. Knowledge is a super power. Knowledge is success, knowledge is money, knowledge is freedom.

Knowledge is power.

If you want to be a successful Forex trader, and make money from Forex trading, you have to have knowledge. The more knowledge you have, the more successful you will be, the more money you will make, and the more freedom you will have to enjoy that money.

A lot of people tell me that they want to become professional Forex traders. They want to give up their current job, and they want Forex to be their new job. If this is you, ask yourself this question. If you saw an advert for a job as a Forex trader in the city of London would you apply for this job? The answer would probably be no. Why? because you don’t know how to trade. So if you do not have the knowledge and the required skill to get a job as a Forex trader in the city, what makes you think that you can give up your day job and become a full time Forex trader? Can you see the problem?

I am a professional Forex trader, and i can help you become a professional Forex trader, but its not going to happen overnight. To get to the stage where you can give up your job and become a full time Forex trader, you need to have the required knowledge and skill needed to enable you to apply for that job in the city.

Fore more information on how to make money from Forex trading please consider my Forex training course. I will give you all the training, knowledge, and skill needed, to enable you to give up your job, and become a professional Forex trader.

Forex Candlestick Patterns. How To Trade Outside Bars.

What is an outside bar?

how to trade outside barsAnother very common and successful candlestick pattern is an outside bar, or engulfing bar as they are sometimes called, because they engulf the previous candle. Knowing how to trade outside bars will put plenty of pips in your trading account. Outside bar candlestick patterns are far more reliable trading signals than inside bar patterns are. If you know how to trade inside bars then trading outside bars is very much the same.

The picture on the right shows a bearish outside bar candlestick pattern. Here you can see that the bearish red candle is completely outside the bullish green candle. The red candle completely engulfs it, hence the term engulfing bar.

Why are outside bars more reliable than inside bars?

Outside bars represent a total shift in sentiment (in this case from bullish to bearish). The bearish price action in the red candle is far greater than the bullish green candle, so we have had a total shift in sentiment from bullish to bearish. The red candle is twice the size of the green candle which indicates strong selling pressure.

If you compare the outside bar price action to the price action of an inside bar, where the candle is a lot smaller than the preceding mother candle, you can understand that a bigger candle means a bigger shift in sentiment, which equals a more reliable trade, and that is why outside bars are more reliable candlestick patterns than inside bars are.

How to trade outside bars.

The general rules on how to trade outside bars would be to enter the trade at the breakout of the red outside bar. Some traders prefer to see a retrace of the outside bar before taking the trade. The only problem with taking the trade on a retrace of the outside bar, is you may not get a breakout, you may get another inside bar instead, and then the trade becomes a lot less reliable.

My advice would be similar to the advice i gave on how to trade inside bars, which is wait for the breakout, and then look for the retrace, before entering.

For more information on how to trade outside bars please consider my Forex training course.

If you found this article to be helpful to you, please like it on Facebook, share it on Twitter, or bookmark it using the social bookmarking buttons below. Thanks. 🙂

Forex Candlestick Patterns. How To Trade Inside Bars.

How to trade inside bars.

Of the numerous price action Forex candlestick patterns that present themselves on a daily basis, inside bars are probably seen more often than any other pattern. Knowing how to trade inside bars will give you an edge in your Forex trading.

So what is an inside bar?

price action inside barsIts a pretty simple answer. An inside bar is a candle that forms inside another candle. If you look at the picture on the right you will see an example of a bullish inside bar. For a candle to qualify as an inside bar, it has to be inside the candle to its left, as per the picture. The red candle to the left of the green inside bar is commonly called the mother candle.

If the green candle was to the left of the mother candle it would not qualify as an inside bar. An inside bar has to be to the right of the mother candle. A mother candle that has an inside candle to its left is called an outside bar. An outside bar is a totally different candlestick pattern to an inside bar, and has a totally different meaning. You can find information here on how to trade outside bars.

So what does an inside bar signify?

An inside bar can mean one of 2 things primarily. In a trending market it can mean a reversal is likely, or it can mean a trend continuation is likely. The concept behind an inside bar is the market is showing indecision or consolidation after a big move. The red candle is a big move down and sentiment has changed from bearish to bullish. This could be a temporary change in sentiment, which would result in a trend continuation, or the start of an overall change in sentiment, which would lead to a reversal.

The candles preceding the inside bar are a good indication of whether a trend continuation or reversal is likely. Also the level at which the inside bar presents itself is also a good indication of what the likely outcome will be.

Trading guidelines for inside bars.

The general rule on how to trade inside bars would be to enter the trade at the breakout of the red mother candle. If you are trading the reversal, you would trade the breakout of the mother candle to the upside in this instance. If you were trading a trend continuation move, you would trade the breakout to the downside.

I don’t generally trade breakouts, but if i was trading this set up i would personally like to see a convincing breakout of the mother candle, and then a retest of the inside bar before i would take the trade. I like to enter my trades at the best possible price, and when you are trading breakouts you do often see a little retrace, or re test of the breakout area, before a continuation, and that is where i would like to get in, as you are getting a discount to the price paid by the breakout traders. This strategy does run the risk of missing the breakout though, as the price does not always come back for the re test.

For more information on how to trade inside bars please consider my price action Forex training course.

If you found this article to be helpful to you, please like it on Facebook, share it on Twitter, or bookmark it using the social bookmarking buttons below. Thanks. 🙂

Why Do Pin Bar Reversal Candles Fail?

If you read my article on the pin bar rejection candle, you should know what one is. But not all pin bar reversal candles, or rejection candles work out. Why do some pin bar reversal candles fail, while others pay out?

Here are 3 reasons why pin bar reversal candles could fail.

1. A news release.

A classic reason for a pin bar reversal failure is a news release. I do not trade through news, but news can dramatically affect the likelihood of a successful outcome of a pin bar reversal set up. As a Forex trader you should always be aware of news releases, to make sure you are not either in a trade when news is coming up, or are about to get into a trade when news is pending. I subscribe to a news feed called Talking Forex that keeps me updated on any price sensitive news no matter how small it may be.

2. The components of the pin bar reversal candles.

bearish pin bar reversal candleHow the candle is made up can also affect how successful the set up will be. The ideal components of pin bar reversal candles are a long pin, or wick as some people call it, and a small body. If the body is too large, or the pin is too small the likelihood is it will not work.

The picture on the right is a great example of a bearish pin bar reversal candle. You can see the wick is nice and large, and the body is small. It is also beneficial that the body is red if its a bearish candle, as this one is, or that it is green in the case of a bullish reversal candle.

You can see how successful this bearish pin bar set up is by the strong move down on the candle to the right of the pin bar. A lot of Forex traders would have recognized this great pin bar set up and quickly jumped into short positions to promote the aggressive move down in price that we can see.

3. The location of the pin bar reversal candles.


The location of the pin bar is a common reason for a pin bar set up to fail. If the pin bar is located at the wrong position within a trend it will fail. Pin bars work best when they are located at a swing high or swing low within a trend.

If a pin bar is located between 2 candles there is also a likelihood that it will fail. The pin bar set up works better when the pin bar is protruding from the 2 candles either side of it.

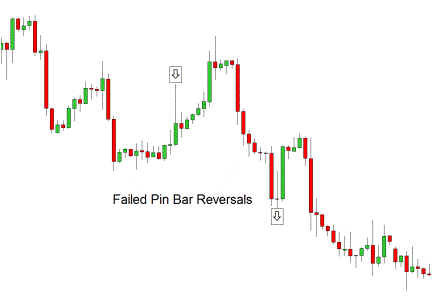
failed pin bar reversal chart

The chart above shows a number of pin bar set ups. Two that have failed and one that has worked out nicely. The two that have failed are marked with arrows.

You can clearly see from left to right that the first pin bar has failed for 2 reasons. The first reason was the size of the body. The second reason is the location within the trend. Also the body is bullish (green) and it should ideally be bearish (red).

The second pin bar set up worked out nicely for 4 reasons. The pin bar has a nice small body, that is the correct colour for a bearish set up (red), and its at the swing high within the down trend, and it is protruding from the candles around it.

The third pin bar failed because of its location within the trend and the candles either side of it. You can see that the pin bar has a nice wick and a very small almost non existent body, which is very good, but its totally in the wrong position within the move down, it is positioned at a swing low, and it is overpowered by the 2 candles either side of it.

Pin bar reversal candles work very well when the correct set up presents itself. This article covers basic price action set ups. What i teach is advanced price action trading. If you wish to learn how to trade Forex using advanced high probability price action Forex trading, please consider my Forex training course.

If you found this article to be helpful to you, please like it on Facebook, share it on Twitter, or bookmark it using the social bookmarking buttons below. Thanks. 🙂

How To Correctly Draw Support And Resistance Lines.

Support and resistance trading.

Support and resistance trading is a major part of price action Forex trading. How the price reacts around support and resistance lines, gives a good indication of what the price is likely to do next. Knowing how to correctly draw support and resistance lines on your Forex chart, will give you a trading edge.

Support and resistance lines can be drawn on any time frame, but i generally do not draw them on time frames of less than 1 hour, as too many lines on your chart can be counter productive, and inhibit your study of price action.

Where to draw support and resistance lines.

This is very much open to interpretation. Some traders draw support and resistance lines from the open and or close of the candle (the candle body). So if you imagine a candle without pins, that is where they will draw their SR lines from. Some traders believe that the opening and closing price of the candle, is more important than the price it went to within the candle formation, which produces the pins.

I think the opposite of that. The overall candle including the pins is where in my opinion you should be drawing your support and resistance lines from. I will explain my reason for that view. Within every candle there is a series of smaller candles. A daily candle for example is made up of 6 four hour candles, 24 one hour candles, 96 fifteen min candles, and so on. Now if you are drawing your SR lines from the body of a daily candle for example, you are not including the complete price action of that day. By drawing your SR lines from the top or bottom of a candle, including the pins you are covering all the price action from that day, swing high to swing low. The same applies on a H4 candle or a h1 candle. By drawing SR lines from the top or bottom of a H4 candle, you are covering all the price action within 4 H1 candles.

How to correctly draw support and resistance lines.

The main thing you need to look for when drawing your support and resistance lines is areas on the chart where price has previously reversed. You need to make sure your SR line is at the top of the candle (including the pin) for resistance, and the bottom of the candle (including the pin) for support. If you can find 2 or more reversal areas at the same price, then that is where you need to put your SR line.

Sometimes you cannot find 2 or more areas at the same price so you need to look for areas that are as close to the reversal area as possible. A general area of rejection will sometimes be enough to give you a potential support or resistance line.

Support and resistance charts.

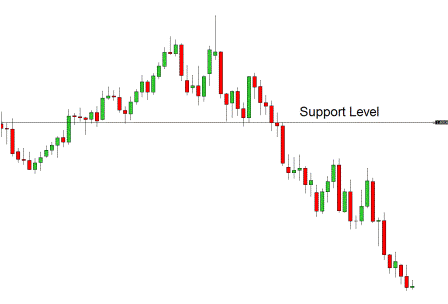
The charts below will give you a good example of how to correctly draw support and resistance lines.

support level on Forex chart You can clearly see the support level on this chart. There is also a nice pin bar rejection candle at the high of the move.

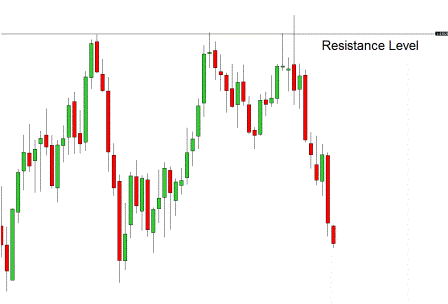
resistance level on Forex chart

Here is a good example of resistance on a clean Forex chart. Another bearish pin bar rejecting the resistance level.

I hope this article has helped you learn how to correctly draw support and resistance lines.

If you found this article to be helpful to you, please like it on Facebook, share it on Twitter, or bookmark it using the social bookmarking buttons below. Thanks. 🙂

Forex Candlestick Patterns. The Pin Bar Rejection Candle.

There are many Forex candlestick patterns, but in this article we will look at a bearish pin bar rejection candle.

A pin bar, or hammer candle, as some traders call it, is a very good signal of a price reversal. Price reversals are the holy grail of Forex trading, and my whole trading strategy is based on using Forex candlestick patterns, to find levels on the chart, where there is a high probability that the price will reverse. If you can identify price reversals with high probability, then you will consistently make money from Forex trading. Forex candlestick patterns are a major part of price action Forex trading, and when mastered they can produce some very profitable trades.

Forex candlestick patterns

So what is a pin bar rejection candle, and how is it formed?

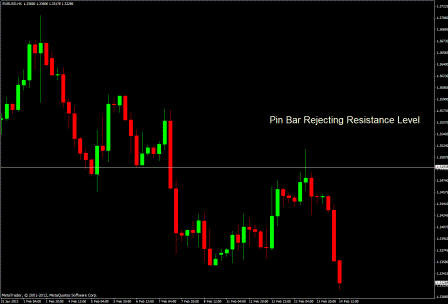
The above chart shows a bearish pin bar reversal candle on the Euro Dollar pair that formed this week, which resulted in a very profitable trade. I took this trade and banked 83 pips from the move down.

The concept behind this bearish pin bar candle, or any pin bar candle is shift in sentiment. In this pin bar candle the sentiment shifted from bullish to bearish. At one point in the candle formation the candle was totally green, and buyers were in control of price, and were happy to buy at this level. At the top of the pin bar the buyers ran out, and the sellers took over, forcing the price back to almost the opening level.

As this pin bar is a 4 hour candle, the buyers at the top of the candle were now sitting on heavy losses, and the sellers were sitting on a nice profit. Now, one of 2 things can happen next, buyers could either see value at a lower price, and add to their position, which would push the price back up and force sellers out, or they could have a shift in sentiment and close their trade for a loss, which would further add to the selling pressure, and push the price down further. In this case they had a change of heart and closed their trades for a loss. This change of sentiment together with sellers adding to their already profitable positions, sees the price move lower. When the candle closes as a pin bar, this signals that sellers are in control of price, and more sellers join the party, which pushes the price down further, and starts a major move down.

To add to the negative sentiment the pin bar has rejected at a key level of resistance, which encourages even more sellers into the market, which adds further weight to the move down.

Forex Candlestick Patterns.

If you study Forex candlestick patterns, you will see the pin bar rejection candle on many different time frames, and at many different levels on the chart, but they do not always indicate that a reversal is imminent. Some work, but some fail. You have to know with the highest probability which ones will work, and which ones will fail, and this is where i come in. I have studied Forex candlestick patterns for over 8 years and i can predict with the highest probability which will work and which will fail. Please see my Forex training course for more information.

If you found this article to be helpful to you, please like it on Facebook, share it on Twitter, or bookmark it using the social bookmarking buttons below. Thanks. 🙂

Support And Resistance Trading.

Support and resistance trading plays a major part in price action trading. Support and resistance lines are drawn on a chart to determine possible reversal points. If the price has reversed at a certain price level on the chart before, there is a possibility that it will reverse again at the same point when it returns to that price level.

The reason we draw support and resistance lines is very simple. If you have a support or resistance line drawn on your chart at a price reversal level, you can clearly see when the price gets to that level. If you are in a trade, you may want to get out at a support and resistance level as there is the potential for the price to reverse at that point.

The importance of support and resistance trading.

It is important to draw support and resistance lines on your chart when you are trading, as lots of traders pay attention to support and resistance trading, so it is often a good place to enter or exit a trade, as mentioned above.

support and resistance trading chart

Areas of support and resistance hold a great deal of information about which way the market will go when it hits a support or resistance line. Will it reverse at a support and resistance line or will it go right through. This is a major dilemma for many traders, and knowing what will happen at this point will make you a lot of money.

I discuss support and resistance trading at length in my Forex training course and i can give you the knowledge you need to predict with the highest probability what will happen when the price comes up to a support and resistance line.

For more information on my course please click on the link. Forex training course.

If you found this article to be helpful to you, please like it on Facebook, share it on Twitter, or bookmark it using the social bookmarking buttons below. Thanks. 🙂

What Is Price Action Forex Trading?

What is price action Forex trading?

Many people ask me what is price action Forex trading. Price action Forex trading is a trading style that uses no indicators to determine movements in the Forex markets. One of the plus points of trading with price action is the fact that you have a plain uncluttered chart that is free from confusing indicators.

Many traders that use indicators can get bogged down with too much clutter on the charts which inhibits the view of the real thing that you need to focus on, and that is price. The majority of price action Forex traders, trade a clean chart, with maybe one or 2 moving averages on, and a few support and resistance lines. This is the way most professional Forex traders trade the markets, so it makes sense to do the same.

When you have an understanding of price action Forex trading you can predict with high probability what is going to happen next to price. This gives you an edge over Forex traders that use indicators, as generally by the time the indicator has given them a signal to enter a trade, the trade is already over.

Confluence.

Many traders look for confluence to give them a trading signal. Confluence (in case you have not heard of it before) is when multiple factors come together to give a signal to trade. For example if the price is coming up on a support or resistance line, and you also have a trend line that meets at the price point, that is an area of confluence. Now a lot of traders make the mistake of loading the chart with indicators in the belief that the more indicators you have, the more confluence you will have. This can work some of the time, but its not a reliable way to trade. I explain all about why this type of trading does not work in my Forex training course.

This is not confluence this is confusion.forex indicators

You can see from the above chart the confusion caused by loading your chart with indicators. You don’t need indicators on your chart to be able to trade correctly. The only thing you need to look at is price. So now when someone asks you what is price action Forex trading you can now tell them. Its what you need to learn in order to be a successful Forex trader.