Support and resistance trading.
Support and resistance trading is a major part of price action Forex trading. How the price reacts around support and resistance lines, gives a good indication of what the price is likely to do next. Knowing how to correctly draw support and resistance lines on your Forex chart, will give you a trading edge.
Support and resistance lines can be drawn on any time frame, but i generally do not draw them on time frames of less than 1 hour, as too many lines on your chart can be counter productive, and inhibit your study of price action.
Where to draw support and resistance lines.
This is very much open to interpretation. Some traders draw support and resistance lines from the open and or close of the candle (the candle body). So if you imagine a candle without pins, that is where they will draw their SR lines from. Some traders believe that the opening and closing price of the candle, is more important than the price it went to within the candle formation, which produces the pins.
I think the opposite of that. The overall candle including the pins is where in my opinion you should be drawing your support and resistance lines from. I will explain my reason for that view. Within every candle there is a series of smaller candles. A daily candle for example is made up of 6 four hour candles, 24 one hour candles, 96 fifteen min candles, and so on. Now if you are drawing your SR lines from the body of a daily candle for example, you are not including the complete price action of that day. By drawing your SR lines from the top or bottom of a candle, including the pins you are covering all the price action from that day, swing high to swing low. The same applies on a H4 candle or a h1 candle. By drawing SR lines from the top or bottom of a H4 candle, you are covering all the price action within 4 H1 candles.
How to correctly draw support and resistance lines.
The main thing you need to look for when drawing your support and resistance lines is areas on the chart where price has previously reversed. You need to make sure your SR line is at the top of the candle (including the pin) for resistance, and the bottom of the candle (including the pin) for support. If you can find 2 or more reversal areas at the same price, then that is where you need to put your SR line.
Sometimes you cannot find 2 or more areas at the same price so you need to look for areas that are as close to the reversal area as possible. A general area of rejection will sometimes be enough to give you a potential support or resistance line.
Support and resistance charts.
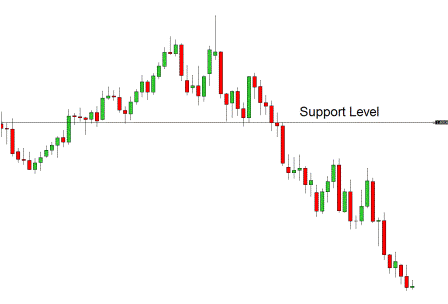
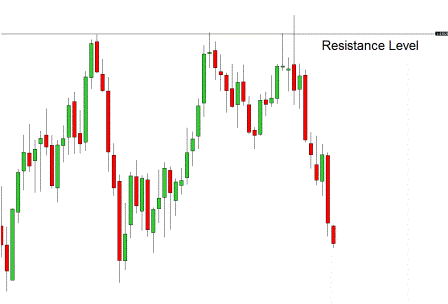
The charts below will give you a good example of how to correctly draw support and resistance lines.
 You can clearly see the support level on this chart. There is also a nice pin bar rejection candle at the high of the move.
Here is a good example of resistance on a clean Forex chart. Another bearish pin bar rejecting the resistance level.
I hope this article has helped you learn how to correctly draw support and resistance lines.
If you found this article to be helpful to you, please like it on Facebook, share it on Twitter, or bookmark it using the social bookmarking buttons below. Thanks. 🙂


