Knowing how to identify supply and demand areas on a chart will help you to make more informed trading decisions.
What are supply and demand areas?
Supply and demand areas are all over a chart on every time frame, supply and demand makes the market work, as it creates an imbalance in the market, and that imbalance is what makes the price go up and down.
For example: Prices move up and down on perceived value. Say Euro Dollar is trading at 13500. Some people may think that is expensive, some people may think that is cheap. The people that think its cheap are buying, and the people that think its expensive are selling.
Now, if you have an equal number of buyers and sellers on both sides, then price will stay at 13500. The currency has reached its fair value according to buyers and sellers. Price will stay at fair value until an new imbalance of buyers and sellers is found. As new buyers and sellers are continually coming into the market, fair value can last a few seconds, or price can literally trade around the fair value area for ever in theory. Until a new imbalance comes into the market, the price will not move from the 13500 area.
Its not just about the buyers and the sellers.
Now consider this, its not just about the buyers and the sellers in the market, its also about the price.
Price is the most important thing in Forex trading, and you should never forget that.
To create an imbalance you must have more buyers at a higher price than the current price, or more sellers at a lower price than the current price. You may have more buyers than sellers in the market, but the price could still go down. Or you may have more sellers than buyers in the market but the price could still go up. How does that work then? I will try to explain.
Say you have 1000 sellers around the 13500 area, but you have 100 buyers that are buying from 13480 up to 13520. Sellers out number buyers 10 to 1, but if the cumulative value of their sell orders, are not larger than the cumulative value of the 100 buyers orders, then price will still go up. The total value of the buy orders, are worth more than the total value of the sell orders, so the demand for Euro Dollar is outstripping supply, so the price continues to go up.
When the last of the buy orders are filled at 13520, and just another 50 sellers come back into the market at 13520, and the cumulative number of sell orders is outstripping the now very small amount of cumulative buy orders, you then have more supply than demand and the price will do down. So to recap, more cumulative supply and the price goes down, more cumulative demand and the price goes up.
How to identify supply and demand areas.
Now this is the tricky bit. How do you know when supply is outstripping demand or vise versa? And more importantly, how do you know when fair value has been reached? and how do you know when supply will change to demand, or demand will change to supply?
This is the holy grail as far as Forex trading is concerned. If you can identify when price will switch from supply to demand, or demand to supply, you are effectively identifying key reversal levels in the market. And if you can identify these reversal levels in the market with high probability, then you have a license to print money. A lot of what i teach in my Forex training course is about how to identify key reversal levels in the market.
Identifying these reversal levels is not as easy as it may look though. Well unless you have access to every brokers order book, which you don’t. So in the absence of every brokers order book, you have to study the chart to identify possible supply and demand areas from which to buy and sell. I cannot go in to detail about what i teach in my course, and how i identify reversal levels in the market, but you can use previous areas of supply and demand, as possible new areas of supply and demand, rather like a trader would use previous support and resistance levels, as possible areas to buy and sell.
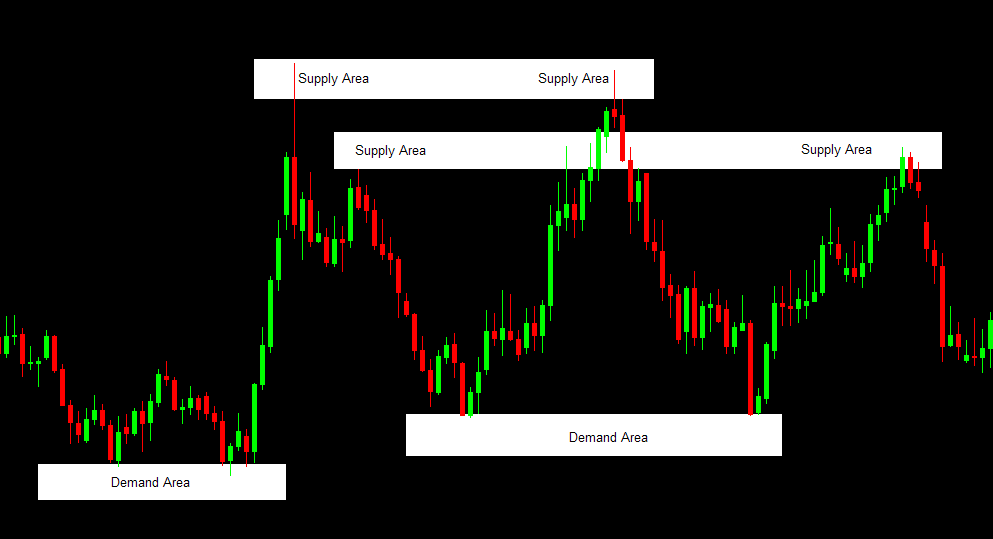
The chart below shows you how previous supply and demand areas are respected, and how trading long and short from those areas would have produced nice profitable trades.

Rather like support and resistance levels, sometimes old supply and demand areas produce some nice trades, but also like SR levels they don’t always work. The skill is in knowing which ones will work, and which ones will fail, and i can teach you how to identify the supply and demand areas that will work, which will enable you to take high probability profitable trades from those areas.

