How To Correctly Draw Support And Resistance Lines.

Support and resistance trading.

Support and resistance trading is a major part of price action Forex trading. How the price reacts around support and resistance lines, gives a good indication of what the price is likely to do next. Knowing how to correctly draw support and resistance lines on your Forex chart, will give you a trading edge.

Support and resistance lines can be drawn on any time frame, but i generally do not draw them on time frames of less than 1 hour, as too many lines on your chart can be counter productive, and inhibit your study of price action.

Where to draw support and resistance lines.

This is very much open to interpretation. Some traders draw support and resistance lines from the open and or close of the candle (the candle body). So if you imagine a candle without pins, that is where they will draw their SR lines from. Some traders believe that the opening and closing price of the candle, is more important than the price it went to within the candle formation, which produces the pins.

I think the opposite of that. The overall candle including the pins is where in my opinion you should be drawing your support and resistance lines from. I will explain my reason for that view. Within every candle there is a series of smaller candles. A daily candle for example is made up of 6 four hour candles, 24 one hour candles, 96 fifteen min candles, and so on. Now if you are drawing your SR lines from the body of a daily candle for example, you are not including the complete price action of that day. By drawing your SR lines from the top or bottom of a candle, including the pins you are covering all the price action from that day, swing high to swing low. The same applies on a H4 candle or a h1 candle. By drawing SR lines from the top or bottom of a H4 candle, you are covering all the price action within 4 H1 candles.

How to correctly draw support and resistance lines.

The main thing you need to look for when drawing your support and resistance lines is areas on the chart where price has previously reversed. You need to make sure your SR line is at the top of the candle (including the pin) for resistance, and the bottom of the candle (including the pin) for support. If you can find 2 or more reversal areas at the same price, then that is where you need to put your SR line.

Sometimes you cannot find 2 or more areas at the same price so you need to look for areas that are as close to the reversal area as possible. A general area of rejection will sometimes be enough to give you a potential support or resistance line.

Support and resistance charts.

The charts below will give you a good example of how to correctly draw support and resistance lines.
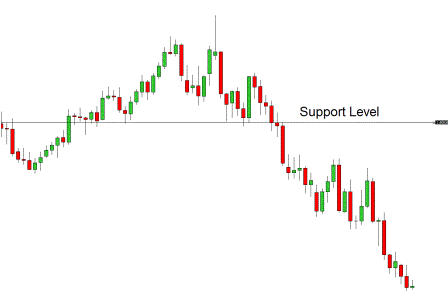
support level on Forex chart You can clearly see the support level on this chart. There is also a nice pin bar rejection candle at the high of the move.

resistance level on Forex chart

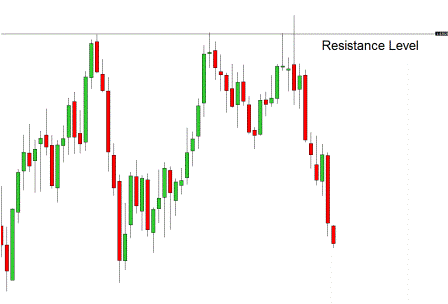
Here is a good example of resistance on a clean Forex chart. Another bearish pin bar rejecting the resistance level.

I hope this article has helped you learn how to correctly draw support and resistance lines.

If you found this article to be helpful to you, please like it on Facebook, share it on Twitter, or bookmark it using the social bookmarking buttons below. Thanks. 🙂
Forex Candlestick Patterns. The Pin Bar Rejection Candle.

There are many Forex candlestick patterns, but in this article we will look at a bearish pin bar rejection candle.

A pin bar, or hammer candle, as some traders call it, is a very good signal of a price reversal. Price reversals are the holy grail of Forex trading, and my whole trading strategy is based on using Forex candlestick patterns, to find levels on the chart, where there is a high probability that the price will reverse. If you can identify price reversals with high probability, then you will consistently make money from Forex trading. Forex candlestick patterns are a major part of price action Forex trading, and when mastered they can produce some very profitable trades.

Forex candlestick patterns

So what is a pin bar rejection candle, and how is it formed?

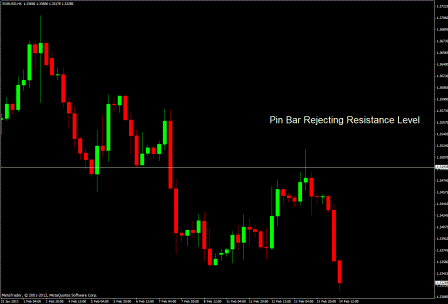
The above chart shows a bearish pin bar reversal candle on the Euro Dollar pair that formed this week, which resulted in a very profitable trade. I took this trade and banked 83 pips from the move down.

The concept behind this bearish pin bar candle, or any pin bar candle is shift in sentiment. In this pin bar candle the sentiment shifted from bullish to bearish. At one point in the candle formation the candle was totally green, and buyers were in control of price, and were happy to buy at this level. At the top of the pin bar the buyers ran out, and the sellers took over, forcing the price back to almost the opening level.

As this pin bar is a 4 hour candle, the buyers at the top of the candle were now sitting on heavy losses, and the sellers were sitting on a nice profit. Now, one of 2 things can happen next, buyers could either see value at a lower price, and add to their position, which would push the price back up and force sellers out, or they could have a shift in sentiment and close their trade for a loss, which would further add to the selling pressure, and push the price down further. In this case they had a change of heart and closed their trades for a loss. This change of sentiment together with sellers adding to their already profitable positions, sees the price move lower. When the candle closes as a pin bar, this signals that sellers are in control of price, and more sellers join the party, which pushes the price down further, and starts a major move down.

To add to the negative sentiment the pin bar has rejected at a key level of resistance, which encourages even more sellers into the market, which adds further weight to the move down.

Forex Candlestick Patterns.

If you study Forex candlestick patterns, you will see the pin bar rejection candle on many different time frames, and at many different levels on the chart, but they do not always indicate that a reversal is imminent. Some work, but some fail. You have to know with the highest probability which ones will work, and which ones will fail, and this is where i come in. I have studied Forex candlestick patterns for over 8 years and i can predict with the highest probability which will work and which will fail. Please see my Forex training course for more information.

If you found this article to be helpful to you, please like it on Facebook, share it on Twitter, or bookmark it using the social bookmarking buttons below. Thanks. 🙂
Support And Resistance Trading.

Support and resistance trading plays a major part in price action trading. Support and resistance lines are drawn on a chart to determine possible reversal points. If the price has reversed at a certain price level on the chart before, there is a possibility that it will reverse again at the same point when it returns to that price level.

The reason we draw support and resistance lines is very simple. If you have a support or resistance line drawn on your chart at a price reversal level, you can clearly see when the price gets to that level. If you are in a trade, you may want to get out at a support and resistance level as there is the potential for the price to reverse at that point.

The importance of support and resistance trading.

It is important to draw support and resistance lines on your chart when you are trading, as lots of traders pay attention to support and resistance trading, so it is often a good place to enter or exit a trade, as mentioned above.

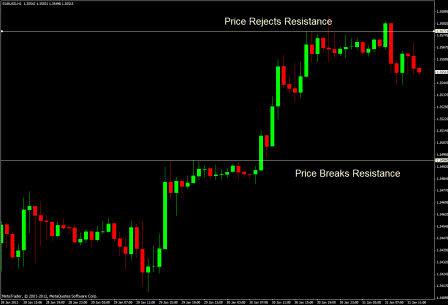
support and resistance trading chart

Areas of support and resistance hold a great deal of information about which way the market will go when it hits a support or resistance line. Will it reverse at a support and resistance line or will it go right through. This is a major dilemma for many traders, and knowing what will happen at this point will make you a lot of money.

I discuss support and resistance trading at length in my Forex training course and i can give you the knowledge you need to predict with the highest probability what will happen when the price comes up to a support and resistance line.

For more information on my course please click on the link. Forex training course.

If you found this article to be helpful to you, please like it on Facebook, share it on Twitter, or bookmark it using the social bookmarking buttons below. Thanks. 🙂
What Is Price Action Forex Trading?

What is price action Forex trading?

Many people ask me what is price action Forex trading. Price action Forex trading is a trading style that uses no indicators to determine movements in the Forex markets. One of the plus points of trading with price action is the fact that you have a plain uncluttered chart that is free from confusing indicators.

Many traders that use indicators can get bogged down with too much clutter on the charts which inhibits the view of the real thing that you need to focus on, and that is price. The majority of price action Forex traders, trade a clean chart, with maybe one or 2 moving averages on, and a few support and resistance lines. This is the way most professional Forex traders trade the markets, so it makes sense to do the same.

When you have an understanding of price action Forex trading you can predict with high probability what is going to happen next to price. This gives you an edge over Forex traders that use indicators, as generally by the time the indicator has given them a signal to enter a trade, the trade is already over.

Confluence.

Many traders look for confluence to give them a trading signal. Confluence (in case you have not heard of it before) is when multiple factors come together to give a signal to trade. For example if the price is coming up on a support or resistance line, and you also have a trend line that meets at the price point, that is an area of confluence. Now a lot of traders make the mistake of loading the chart with indicators in the belief that the more indicators you have, the more confluence you will have. This can work some of the time, but its not a reliable way to trade. I explain all about why this type of trading does not work in my Forex training course.

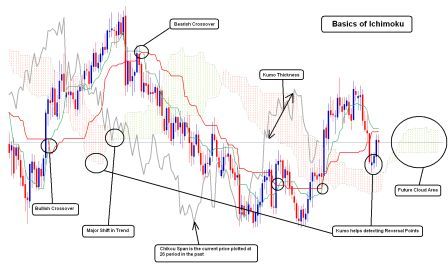
This is not confluence this is confusion.forex indicators

You can see from the above chart the confusion caused by loading your chart with indicators. You don’t need indicators on your chart to be able to trade correctly. The only thing you need to look at is price. So now when someone asks you what is price action Forex trading you can now tell them. Its what you need to learn in order to be a successful Forex trader.